Using the Calendar view
The Calendar view shows a full month of rate data in a grid, with one cell per date across all six properties in your comp set. It's the right view for spotting weekly patterns, period demand, and dates where availability is tightening.
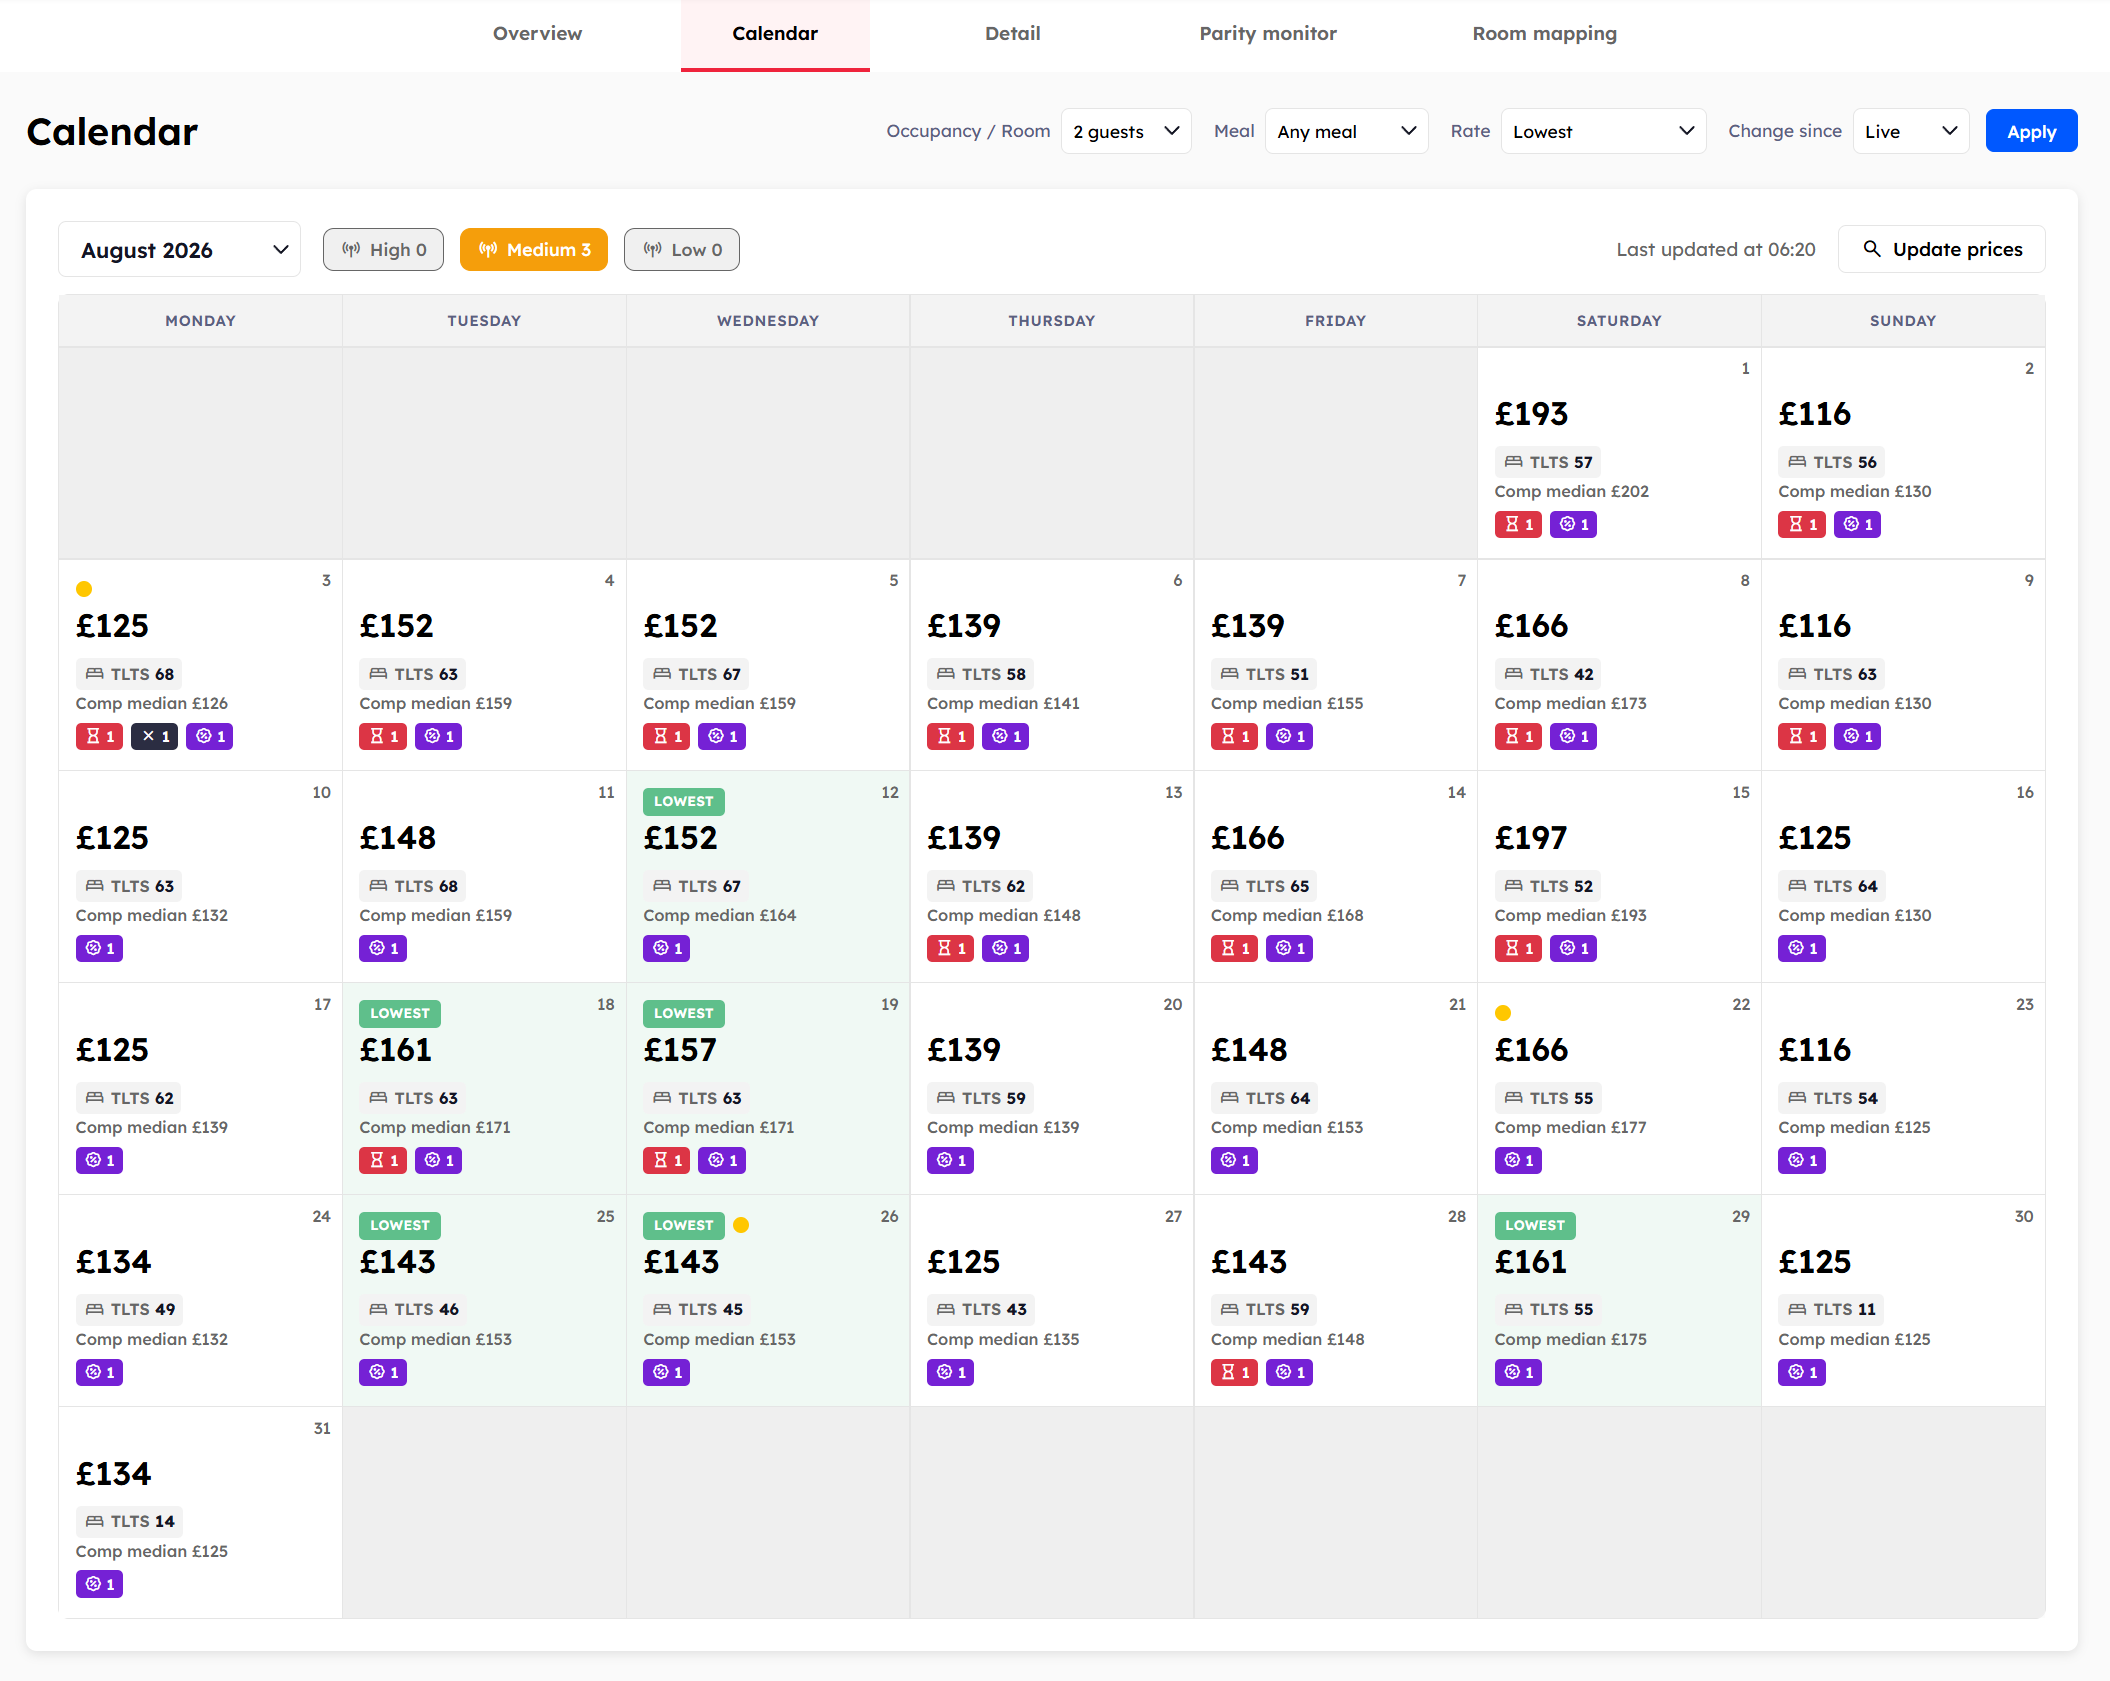
Navigating months
Use the month dropdown at the top of the page to jump between months. You can view the current month and any of the next twelve. The Calendar doesn't show historical months — only current and future dates.
What's in each cell
Each cell can show several pieces of information:
Date number in the corner.
Comp median rate for the date.
A Signal indicator dot if a Signal fired for that date.
Total LTS — your remaining inventory, if Mews is connected.
Cells for sold-out competitors show a dash (—) rather than a price.
Month summary badges
Above the grid, three badges summarise the month:
Low — count of dates where at least one property in your comp set has low availability.
Sold out — count of dates where at least one property is sold out.
Sale — count of dates where at least one property is running a promotional rate.
Click any badge to scroll the calendar to the first matching date.
Actions
The Calendar has the same Update prices and Export buttons as the Overview, with the same Last update X minutes ago timestamp. A manual update refreshes data across all twelve months, not just the one you're viewing.
Was this helpful?
Still need help? Share an idea